Chat on WhatsApp
Sub-Second Power Intelligence & SEC Tracking Cluster C — Production / OEE / IIoT

Industrial Energy Monitoring and Alerts

Compiled Successfully Software Solution delivers industrial energy monitoring and automated alert systems. Interfacing directly with digital multi-function meters (MFMs), sub-meters, and smart circuit breakers via Modbus RTU/TCP and OPC UA, our platform monitors voltage, current, power factor, harmonic distortion, and specific energy consumption (SEC) per manufactured unit in real time.
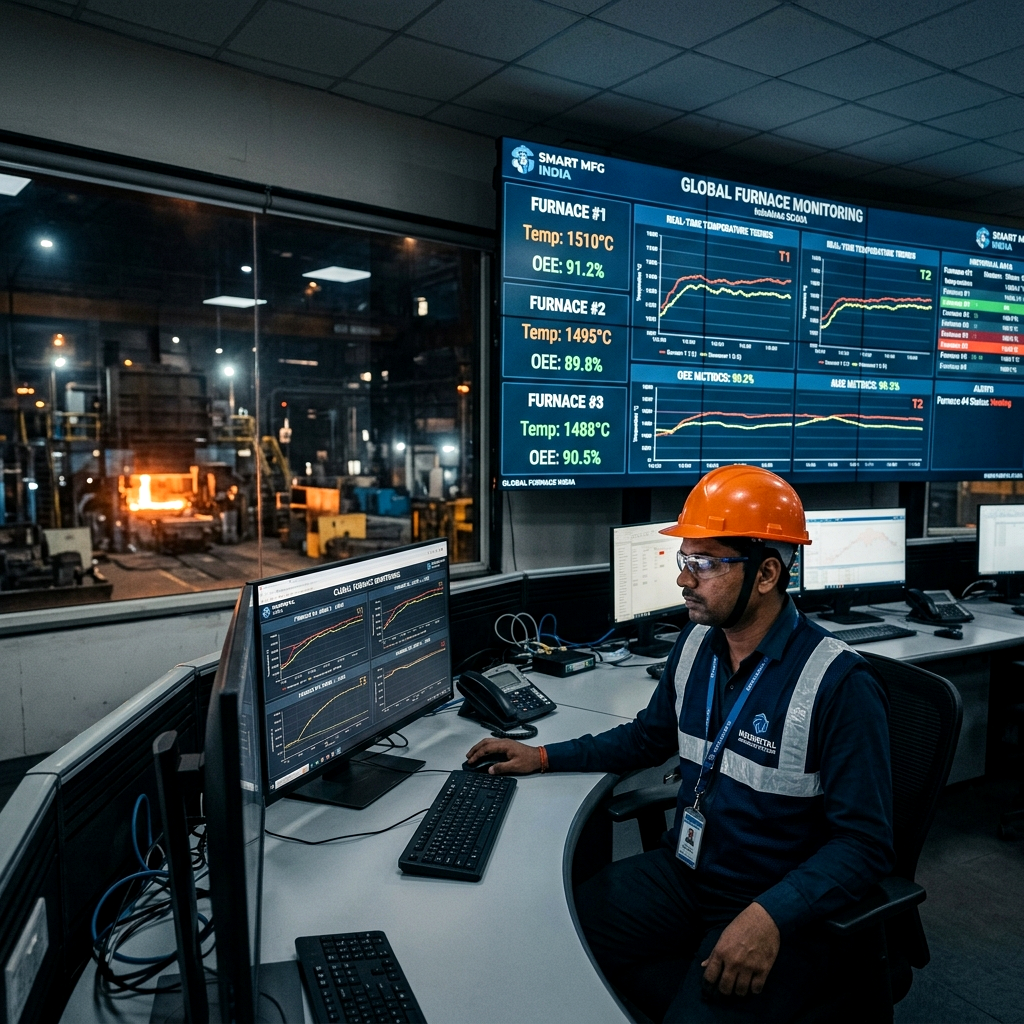
Zero Manual Intervention Multi-Brand PLC Support Sub-Second Latency
Cluster C — Production / OEE / IIoT
LIVE OT STREAM
Industrial Energy Monitoring and Automated Alert System Architecture
< 1.2 ms
Handshake
100%
Zero Data Loss
Multi-PLC
Compatible
The Industrial Challenge

The Carbon and Cost Burden: Invisible Power Spikes and Energy Waste

Industrial facilities consume massive electrical power across motors, compressors, furnaces, and chillers. In most plants, energy consumption is only monitored once a month when the utility bill arrives. Hidden inefficiencies—such as low power factor penalties, unthrottled maximum demand (MD) breaches, motors running dry during non-production periods, and harmonic resonance—cost enterprises millions of rupees annually without leaving an operational trace on the shop floor.

Why Traditional Methods Fail:

Monthly utility statements and quarterly manual meter readings provide zero granularity into which production line, machine, or shift consumed the energy. Without correlating instantaneous kWh consumption with live PLC production piece counts, plant managers cannot calculate Specific Energy Consumption (kWh per unit produced) or prevent costly utility tariff demand penalties before they are incurred.

Critical Pain Points Solved

  • Incurring massive utility surcharges and penalties for exceeding sanctioned contract maximum demand (kVA)
  • Lagging power factor below 0.95 leading to recurring monthly penalties and transformer overheating
  • Inability to benchmark specific energy consumption (kWh/kg or kWh/unit) across shifts and production recipes
  • Auxiliary utilities (compressed air, cooling towers, hydraulic packs) running at full load when lines are idle

Technical Bottlenecks in Heterogeneous Automation

Extracting telemetry from hundreds of distributed energy meters requires high-speed serial multi-drop polling, robust timestamp synchronization with PLC production counters, in-memory peak demand forecasting algorithms, and sub-second alert dispatch across industrial messaging channels.

System Architecture

Edge Energy Acquisition, Real-Time SEC Calculation, and Peak Demand Protection

Our platform polls digital multi-function meters (Schneider, Socomec, L&T, Rishabh, Siemens PAC) over RS-485 Modbus RTU and Ethernet Modbus TCP. By pairing electrical telemetry with live PLC stroke counters, the system continuously calculates real-time Specific Energy Consumption (kWh per finished product). An integrated sliding-window demand predictor calculates rolling 15-minute and 30-minute kVA demand curves, triggering multi-tier alerts to shed non-critical loads before utility thresholds are breached.
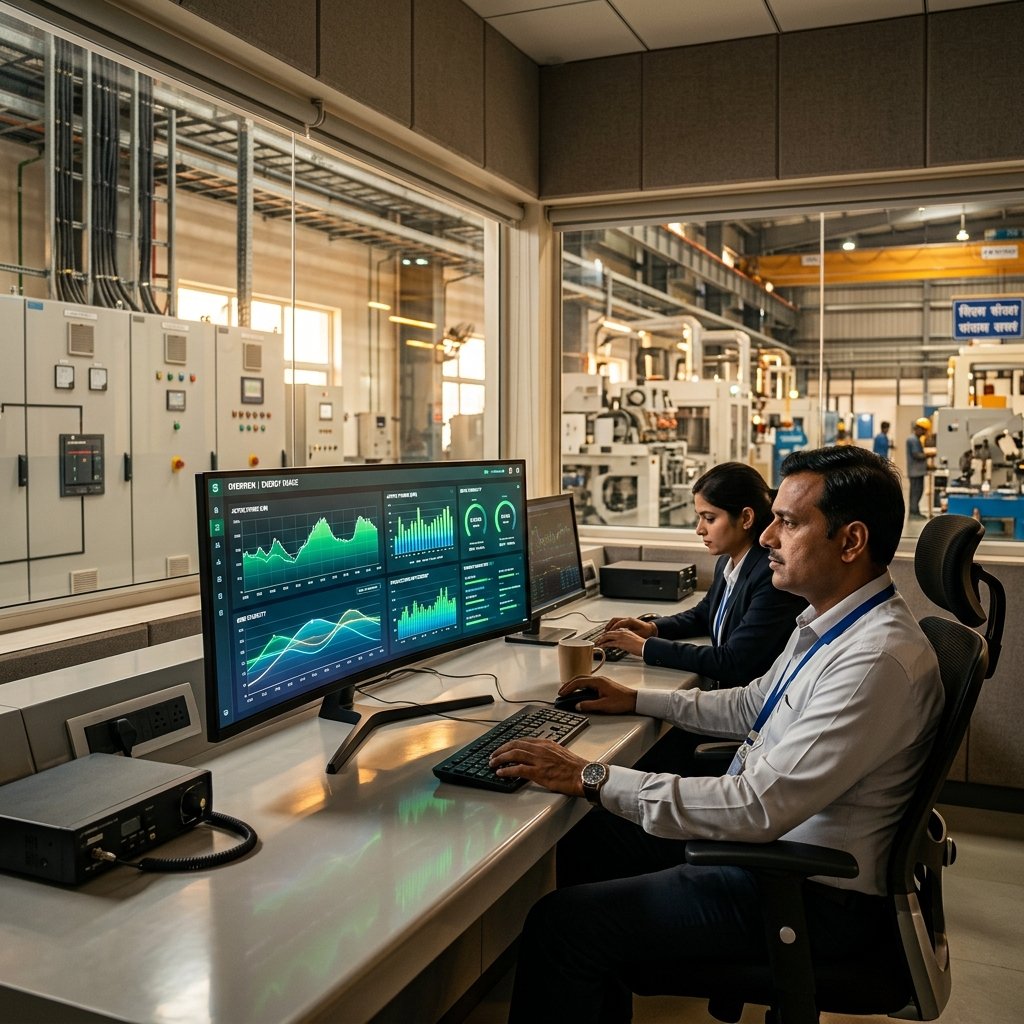
Industrial Energy Monitoring and Multi-Function Power Meter Network
Verified Field Deployment

Industrial shop-floor implementation with sub-second PLC telemetry & automated ERP synchronization.

Operational Blueprint

Transforms electrical energy from an unmanaged overhead into a controllable, itemized manufacturing cost center while protecting the facility from expensive peak demand surcharges.

Our specialized application connects directly to machine controllers and enterprise systems without invasive code modifications, establishing deterministic real-time communication across industrial fieldbuses.

  • Deterministic store-and-forward buffering prevents data dropouts.
  • Sub-second transaction confirmation directly logged to enterprise records.
  • Tested compatibility across leading PLC families and SCADA environments.
Data Flow & Layered Handshake Pipeline
Level 4: Enterprise Layer SAP S/4HANA • SAP ECC • Oracle • Microsoft Dynamics PP, MM, PM, QM, CO Modules
Production Orders • Recipe BAPIs • Bill of Materials • Maintenance Notifications • Yield Confirmation
Integration Engine (Our Application) Compiled Successfully ERP-PLC Integration Bridge Sub-Second Handshake

Transactional Buffer • RFC/BAPI Connectors • Protocol Translation (OPC UA, Profinet, Modbus, MQTT) • Store & Forward Caching

Bidirectional Verification Real-Time OEE Engine Multi-Channel Alarm Dispatch Automated SAP Backflush
Level 2: Supervisory Layer SCADA • Industrial HMI • Andon Boards • Mobile Gateways WinCC, Ignition, Wonderware
Live Machine Mimics • Active Alarm Banners • Operator Recipe Selection • Shift Telemetry
Level 1 & 0: Shop Floor Machinery Siemens • Rockwell Allen-Bradley • Mitsubishi • Schneider • Omron PLCs Fieldbuses • Drives • Sensors
Machine Stroke Pulses • Temperature Sensors • VFD Inverters • Power Meters • Vision Cameras
Continuous Closed-Loop Feedback Flow:

Digital Power Meter → RS-485 Modbus Edge Gateway → Energy Analytics Engine → Rolling Demand Predictor → Automated Load Shedding & Mobile Alert

Transforms electrical energy from an unmanaged overhead into a controllable, itemized manufacturing cost center while protecting the facility from expensive peak demand surcharges.

Technical Capabilities

Core Features & Engineering Specifications

Built for high-speed industrial environments where downtime is measured in seconds.

Utility Penalty Avoidance

Predictive Maximum Demand (MD) Alerts

Tracks rolling 15-minute and 30-minute demand curves against contract utility sanctions. Dispatches warning alerts at 85% and 95% thresholds, triggering automated load-shedding triggers for auxiliary HVAC or compressor banks.

Cost Allocation

Specific Energy Consumption (SEC) per Unit

Dynamically correlates live sub-meter kWh data with PLC finished product counts to compute real-time kWh/part or kWh/ton, enabling precise batch-level energy cost accounting.

Power Quality

Power Factor & Phase Imbalance Alarms

Monitors instantaneous power factor (PF), voltage unbalance, and phase angle discrepancies. Alerts maintenance teams the moment APFC capacitor banks degrade or fail.

Waste Elimination

Non-Productive Energy Consumption Tracking

Detects machinery consuming baseline idle power during planned break times, shift handovers, or machine starvation states, exposing hidden baseline utility drain.

Asset Protection

Total Harmonic Distortion (THD) Monitoring

Measures THD on voltage and current up to the 31st harmonic, alerting engineers when nonlinear VFD loads inject harmonics that stress transformers and switchgear.

Multi-Vendor Interoperability

Hardware & Protocol Support

Direct compatibility with leading global industrial automation and ERP ecosystems.

PLC Controllers

  • Schneider ION / PM series
  • Socomec Diris
  • L&T Quasar / Vega
  • Siemens PAC3200/PAC4200
  • Rishabh RISH Master

Protocols & Buses

  • Modbus RTU over RS-485
  • Modbus TCP
  • OPC UA
  • BACnet/IP
  • EtherNet/IP

Field Devices

  • Current Transformers (CTs 5A/1A)
  • Rogowski Coils
  • Potential Transformers (PTs)
  • APFC Relay Controllers

ERP & SCADA

  • SAP S/4HANA PP/CO (Cost Accounting)
  • Ignition SCADA
  • Wonderware InTouch
  • Siemens WinCC
  • Rockwell FactoryTalk
Operational Pipeline

Step-by-Step Execution Workflow

How data seamlessly flows from top-floor enterprise orders to shop-floor machine feedback.

1

Multi-Drop Meter Telemetry Acquisition

Edge gateways continuously poll digital energy meters over RS-485 daisy chains and Modbus TCP networks, acquiring 3-phase voltage, current, active power (kW), reactive power (kVAR), and apparent power (kVA).

Engineering Detail: Optimized round-robin Modbus polling engine ensures 100+ meter registers are refreshed every 1000 milliseconds without serial bus collisions.
2

Timestamped Production Correlation

The energy data stream is synchronized with machine PLC production counters and SAP active process order numbers to link electrical consumption with physical output.

Engineering Detail: Calculates instantaneous delta-kWh divided by good unit counter delta over configurable 60-second time windows.
3

Demand Curve & Threshold Forecasting

Mathematical sliding-window algorithms project the facility's demand curve to the end of the current utility billing block, predicting potential maximum demand breaches.

Engineering Detail: Utility-aligned 15-minute sliding window algorithm mirrors electrical board bi-directional tariff meters for exact penalty prediction.
4

Automated Multi-Channel Alert & Load Shedding

When demand or power quality thresholds are breached, high-priority notifications are dispatched to plant engineers via SMS, Telegram, and WhatsApp, while sending digital output commands to shed auxiliary loads.

Engineering Detail: Relay contact feedback confirms auxiliary chiller/compressor load cut-off within 500 milliseconds of command execution.
5

Shift Energy Audit & Historical Analytics

Aggregated energy metrics are logged to time-series databases and transmitted to ERP cost accounting systems for automated shift energy billing and carbon footprint tracking.

Engineering Detail: Generates standardized PDF and CSV shift energy balance reports showing department-wise, feeder-wise, and machine-wise kWh consumption.
Industry Applications

Tailored Solutions for Manufacturing Sectors

Proven operational results across discrete and continuous processing plants.

Steel & Metallurgy

Application: Arc furnace and induction furnace continuous power factor and maximum demand monitoring during melt cycles.

Measurable Impact: Eliminated peak demand overdraw penalties and optimized furnace power ramp rates.

Cement & Mining

Application: Ball mill and crusher drive SEC tracking (kWh/ton of crushed clinker) with VFD harmonic monitoring.

Measurable Impact: Reduced energy consumption per ton by 6.4% through shift load balancing.

Textile Spinning & Weaving

Application: Continuous ring-frame motor power tracking and compressor leak detection via baseline energy monitoring.

Measurable Impact: Identified 18 kW of compressed air wastage during non-spinning machine idle states.

Automotive Component Die-Casting

Application: Hydraulic press and electric melting pot power quality and power factor monitoring.

Measurable Impact: Maintained power factor above 0.98 continuously, earning maximum utility rebates.

Chemical & Polymer Extrusion

Application: Extruder barrel heater zone power monitoring and chiller plant coefficient of performance (COP) tracking.

Measurable Impact: Detected degraded heater bands before batch temperature profile failures occurred.
Performance Benchmark

Traditional Methods vs. Compiled Successfully Solution

Why manual spreadsheets, point-to-point scripts, and isolated SCADA fall short.

Evaluation Dimension Traditional / Manual Methods Compiled Successfully Platform Operational Impact
Data Granularity Monthly utility bill or manual daily logbook entries Second-by-second telemetry per machine, feeder, and shift Immediate root-cause identification of energy waste
Maximum Demand Protection Reactive shock when utility bill penalty is received Predictive 15-min sliding window alerts with load-shedding Zero utility peak demand breach penalties
Product Cost Accounting Average energy overhead applied equally across all parts Actual measured kWh per batch and serial number Accurate product profitability and margins in SAP CO
Power Quality Monitoring Annual third-party power quality audit Continuous THD, voltage unbalance, and PF tracking Extended lifespan for transformers, capacitors, and motors
Our Engineering Edge: Direct bridge between electrical sub-meters and shop-floor PLC production counters, providing real-time Specific Energy Consumption (SEC) per SKU that traditional SCADA systems cannot calculate.
Enterprise Grade

Industrial Compliance & OT Cyber-Security

Engineered strictly according to international standards for industrial automation: ISA-95 enterprise-control integration, ISA-18.2 alarm management lifecycle, 21 CFR Part 11 electronic batch records, and TLS 1.3 / mTLS outbound cryptographic security. Built-in Store-and-Forward guarantees zero telemetry loss during network drops.

Outbound-Only TLS 1.3 Encryption
Deterministic Store & Forward
ISA-95 Level 1 to 4 Data Model
ISA-18.2 Alarm Flood Suppression

Ready for a Factory Pilot?

Connect a single production line in under 3 weeks with zero line disruption.

Request Pilot Demo
Industrial Hubs Served

Nationwide Industrial Automation Deployment

Industrial energy monitoring and automated power demand alerting for high-consumption manufacturing plants across India.

Primary Industrial Corridors

  • Maharashtra (Pune, Chakan, Aurangabad)
  • Gujarat (Ahmedabad, Vadodara, Surat)
  • Tamil Nadu (Chennai, Coimbatore, Sriperumbudur)
  • Karnataka (Bengaluru, Peenya, Hosur)
  • NCR (Gurugram, Faridabad, Manesar)

Emerging & Extended Industrial Zones

  • Telangana (Hyderabad)
  • Rajasthan (Bhiwadi)
  • Madhya Pradesh (Pithampur)
  • West Bengal (Howrah)
  • Punjab (Ludhiana)

Frequently Asked Questions

Technical and operational answers for plant managers and automation engineers.

Our system interfaces with existing digital energy meters via RS-485 2-wire serial daisy chains using the Modbus RTU protocol, or over industrial Ethernet using Modbus TCP. We support all major meter brands including Schneider Electric, Socomec, L&T, Siemens, Rishabh, and Yokogawa without requiring replacement of your existing electrical switchgear.

The platform synchronizes the instantaneous active energy (kWh) stream from the machine feeder sub-meter with good part stroke pulses acquired directly from the machine PLC. By dividing the delta energy consumed by the delta pieces produced during each production interval, the system computes live kWh/unit or kWh/ton continuously.

Yes. The system utilizes a mathematical sliding-window demand calculation identical to the integration algorithm used by state electricity boards (15-minute or 30-minute demand windows). It forecasts demand trajectory and dispatches priority alerts at configurable thresholds (e.g., 85% and 92%), and can trigger digital outputs to automatically shed non-essential loads like water pumps, chillers, or air compressors.

The system continuously evaluates instantaneous power factor (lagging and leading), voltage imbalance across phases, and Total Harmonic Distortion (THD). If the power factor drops below your configured threshold (e.g., 0.95), alerts are immediately dispatched to maintenance engineers indicating the specific APFC capacitor bank or feeder responsible.

Yes. Our integration middleware maps aggregated batch and shift energy consumption directly to SAP S/4HANA or ECC Cost Center Accounting (CO-OM) and Product Costing (CO-PC) modules using RFC/BAPI or OData services, enabling accurate energy cost allocation per production order.
Free Demo Available

Ready to Improve Your Factory Alarm & Alert Management?

Discuss your PLC, SCADA, machine monitoring, IIoT or Industry 4.0 requirement with our industrial automation team. See how PLC events, SCADA alarms, machine downtime and industrial conditions can be monitored through web dashboards and mobile alerts.

Serving manufacturing plants across Delhi NCR, Haryana, Maharashtra, Gujarat, Tamil Nadu, and PAN India
Call Now WhatsApp Request Quote