Chat on WhatsApp
Core Controller & Automation Infrastructure Diagnostics Cluster D — Industrial Connectivity / IIoT / Industry 4.0

PLC Health Monitoring System

Compiled Successfully Software Solution delivers comprehensive PLC health monitoring systems. Directly querying controller system diagnostic buffers and status registers across Siemens S7, Rockwell ControlLogix, Mitsubishi MELSEC, Schneider Modicon, and Omron Sysmac, our platform monitors CPU scan cycle times, work memory fragmentation, backup battery voltage, distributed I/O bus health, and communication dropouts in real time.
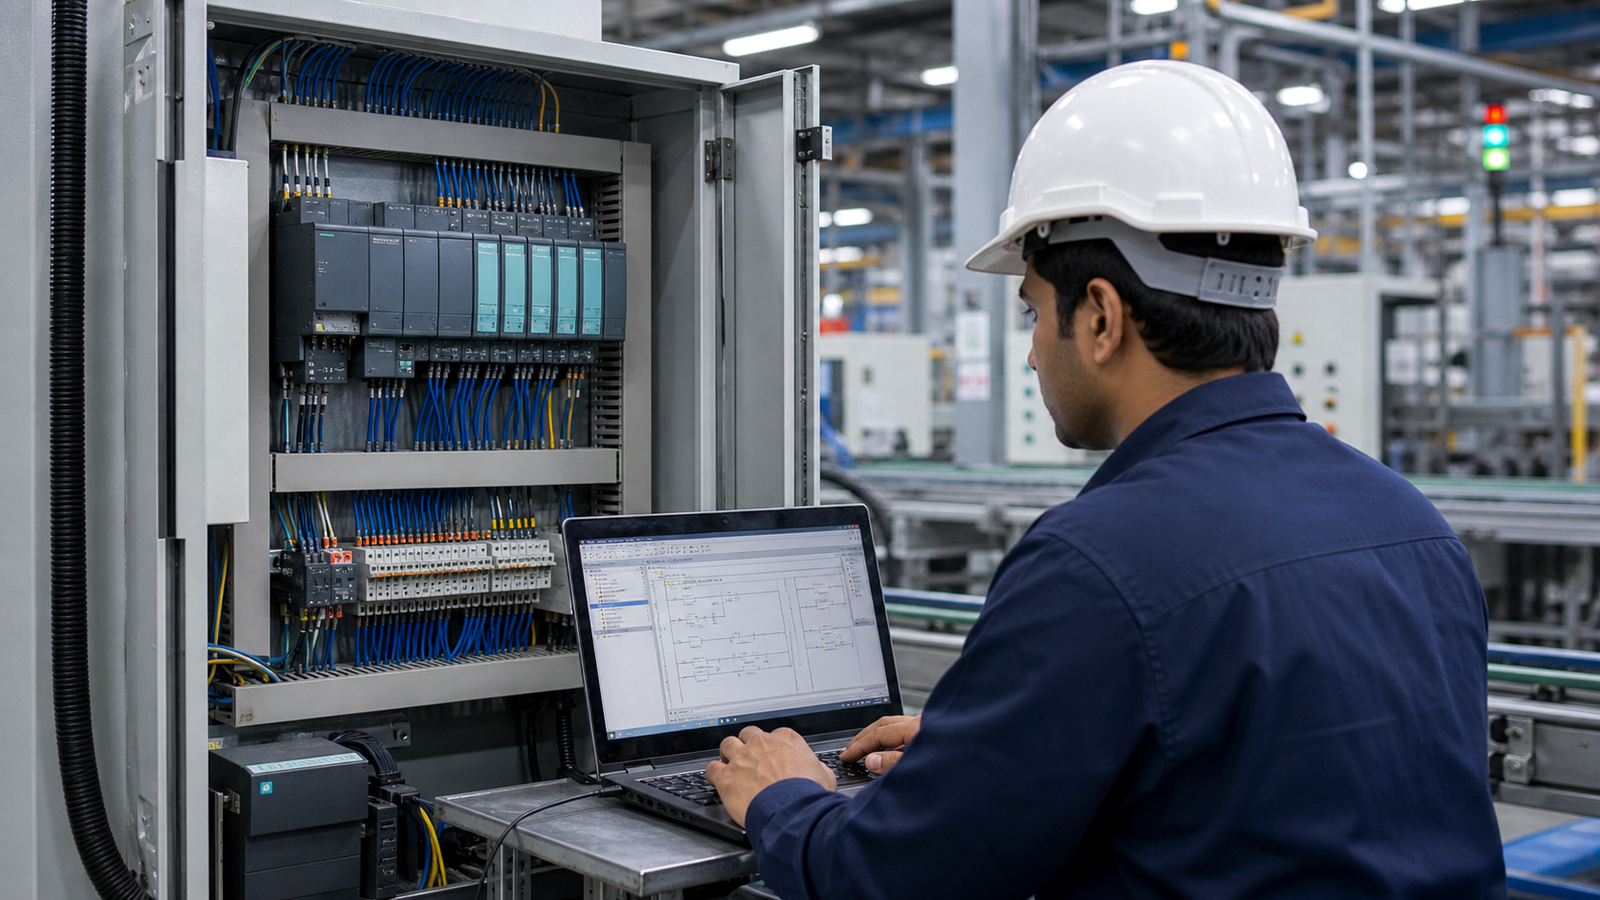
Zero Manual Intervention Multi-Brand PLC Support Sub-Second Latency
Cluster D — Industrial Connectivity / IIoT / Industry 4.0
LIVE OT STREAM
PLC Health Monitoring System Architecture and Diagnostic Buffer Telemetry
< 1.2 ms
Handshake
100%
Zero Data Loss
Multi-PLC
Compatible
The Industrial Challenge

The Silent Controller Freeze: When the Brain of the Factory Fails

Programmable Logic Controllers (PLCs) are the central nervous system of modern production lines. While PLCs are renowned for hardware ruggedness, their internal software and communication environments degrade over time. Gradual logic bloating increases CPU scan cycle times; network packet collisions cause fieldbus dropouts; work memory runs out of allocation space; and internal lithium backup batteries drain. When a PLC unexpectedly halts or drops into "STOP" mode during live production, an entire manufacturing facility can be frozen for hours while engineers scramble with programming cables to diagnose the controller.

Why Traditional Methods Fail:

Conventional SCADA systems only display process variables (temperatures, motor speeds, piece counts). They are completely blind to controller diagnostic metrics—such as CPU scan time spikes, Ethernet link packet discards, peripheral bus CRC errors, or diagnostic buffer warnings—leaving maintenance blind until the PLC executes a hard halt.

Critical Pain Points Solved

  • PLC unexpectedly dropping into STOP mode during active production shifts
  • CPU scan time creep causing delayed sensor responses and intermittent quality defects
  • Distributed I/O bus dropouts causing sporadic machine emergency stops that cannot be reproduced
  • Loss of PLC program and retentive memory following an unmonitored backup battery failure during power cycles

Technical Bottlenecks in Heterogeneous Automation

Monitoring PLC health requires reading internal vendor-specific diagnostic blocks (e.g., Siemens SFC51 / RDSYSST, Rockwell GSV instructions), interpreting system status words, decoding fieldbus network health packets, and dispatching predictive health alerts before CPU watchdog timers trip.

System Architecture

Native System State Telemetry, Scan Time Surveillance, and Diagnostic Buffer Alerts

Our platform queries the system diagnostic layer of connected PLCs over standard Ethernet. It tracks CPU scan times (current, max, average), load memory and work memory usage, firmware versions, battery status, and peripheral bus health (Profinet, EtherNet/IP, CC-Link). When anomalous events occur—such as scan time exceeding 80% of watchdog limits, distributed I/O station communication dropouts, or battery voltage drop—instant diagnostic alerts are dispatched to automation engineers.
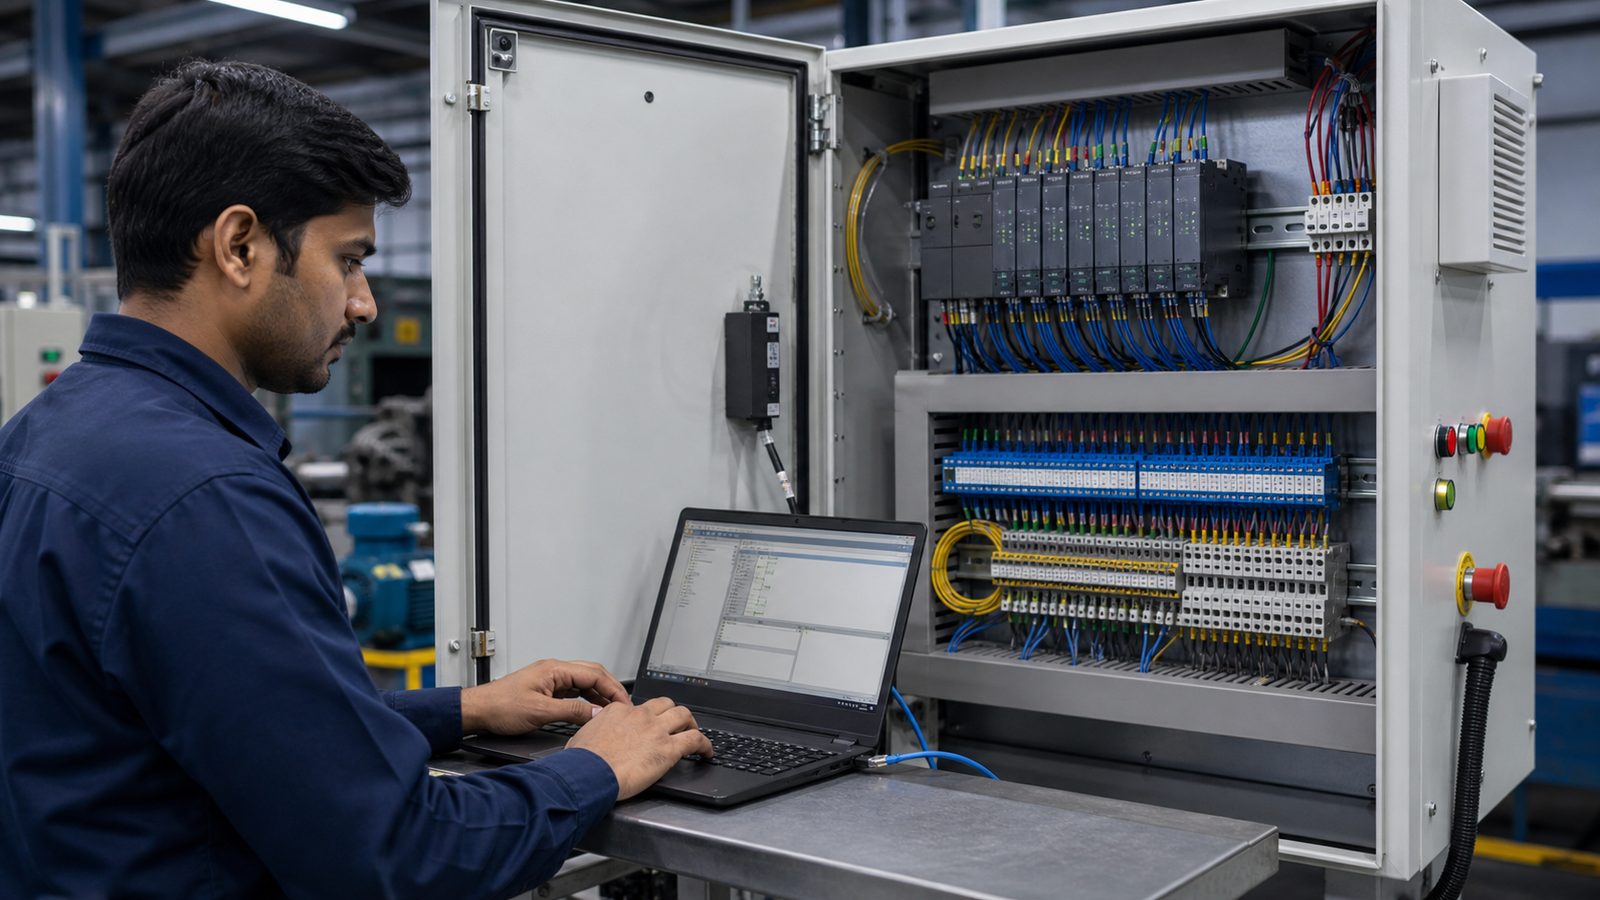
PLC CPU Cycle Time, Battery, and Memory Health Diagnostic Terminal
Verified Field Deployment

Industrial shop-floor implementation with sub-second PLC telemetry & automated ERP synchronization.

Operational Blueprint

Transforms PLC maintenance from an emergency panic into proactive controller lifecycle management, preventing catastrophic production freezes and unrecoverable memory loss.

Our specialized application connects directly to machine controllers and enterprise systems without invasive code modifications, establishing deterministic real-time communication across industrial fieldbuses.

  • Deterministic store-and-forward buffering prevents data dropouts.
  • Sub-second transaction confirmation directly logged to enterprise records.
  • Tested compatibility across leading PLC families and SCADA environments.
Data Flow & Layered Handshake Pipeline
Level 4: Enterprise Layer SAP S/4HANA • SAP ECC • Oracle • Microsoft Dynamics PP, MM, PM, QM, CO Modules
Production Orders • Recipe BAPIs • Bill of Materials • Maintenance Notifications • Yield Confirmation
Integration Engine (Our Application) Compiled Successfully ERP-PLC Integration Bridge Sub-Second Handshake

Transactional Buffer • RFC/BAPI Connectors • Protocol Translation (OPC UA, Profinet, Modbus, MQTT) • Store & Forward Caching

Bidirectional Verification Real-Time OEE Engine Multi-Channel Alarm Dispatch Automated SAP Backflush
Level 2: Supervisory Layer SCADA • Industrial HMI • Andon Boards • Mobile Gateways WinCC, Ignition, Wonderware
Live Machine Mimics • Active Alarm Banners • Operator Recipe Selection • Shift Telemetry
Level 1 & 0: Shop Floor Machinery Siemens • Rockwell Allen-Bradley • Mitsubishi • Schneider • Omron PLCs Fieldbuses • Drives • Sensors
Machine Stroke Pulses • Temperature Sensors • VFD Inverters • Power Meters • Vision Cameras
Continuous Closed-Loop Feedback Flow:

PLC Diagnostic Buffer → System State Telemetry Block → Edge Health Engine → Threshold & Error Decoder → Automation Engineer Alert

Transforms PLC maintenance from an emergency panic into proactive controller lifecycle management, preventing catastrophic production freezes and unrecoverable memory loss.

Technical Capabilities

Core Features & Engineering Specifications

Built for high-speed industrial environments where downtime is measured in seconds.

Scan Time Monitoring

Real-Time CPU Scan Cycle Surveillance

Monitors minimum, maximum, and current cycle scan times in milliseconds. Alerts engineers if logic bloat or communication interrupts cause scan times to spike toward watchdog limits.

Diagnostic Buffer Decoder

Automated Diagnostic Buffer Parsing

Continuously streams the controller's internal diagnostic buffer. Translates raw hex event codes into plain-language descriptions (e.g., "I/O Access Error Rack 1 Slot 3") the moment they occur.

Fieldbus Diagnostics

Distributed Fieldbus & I/O Station Health

Tracks the communication state of all remote I/O drops, Profinet devices, and EtherNet/IP adapters. Pinpoints the exact rack and module experiencing cyclic packet dropouts.

Memory Surveillance

Work & Load Memory Utilization Tracking

Tracks free vs allocated work memory and retentive data blocks. Dispatches warning notifications when memory consumption exceeds 85%, preventing memory overflow halts.

Power & Battery Health

Backup Battery & Power Supply Monitoring

Monitors PLC hardware battery status flags and internal 24VDC backplane voltage rails, preventing silent loss of retentive recipes and timers during plant power outages.

Multi-Vendor Interoperability

Hardware & Protocol Support

Direct compatibility with leading global industrial automation and ERP ecosystems.

PLC Controllers

  • Siemens S7-1500 / S7-1200 / S7-300 / S7-400
  • Rockwell ControlLogix 5580 / CompactLogix 5380
  • Mitsubishi MELSEC iQ-R / Q Series
  • Schneider Modicon M580 / M340
  • Omron NJ / NX Series

Protocols & Buses

  • S7 Communication (ISO-on-TCP)
  • EtherNet/IP CIP Generic
  • SLMP / MC Protocol
  • Modbus TCP
  • OPC UA Alarms & Conditions

Field Devices

  • Distributed I/O Racks (ET 200SP, Point I/O)
  • Industrial Managed Switches
  • Redundant Power Supplies (SITOP)
  • CPU Memory Cards

ERP & SCADA

  • SAP S/4HANA PM
  • Siemens TIA Portal Diagnostic Server
  • Rockwell FactoryTalk Network Manager
  • Ignition SCADA
  • Wonderware System Platform
Operational Pipeline

Step-by-Step Execution Workflow

How data seamlessly flows from top-floor enterprise orders to shop-floor machine feedback.

1

Diagnostic Telemetry Polling

The monitoring agent connects to the PLC's primary communication port, periodically querying system state data structures (SZL in Siemens, GSV in Rockwell).

Engineering Detail: Acquires CPU operating mode (RUN/STOP), current scan time, maximum scan time, and work memory metrics without interrupting logic execution.
2

Fieldbus Topology & Node Verification

Queries the status of all configured Profinet, EtherNet/IP, or Modbus TCP peripheral stations to verify communication integrity across distributed drops.

Engineering Detail: Detects CRC transmission errors, frame jitter, and missed cyclic I/O connection cycles across all remote chassis.
3

Diagnostic Buffer Event Interception

When new events enter the PLC hardware diagnostic buffer (e.g., OB82 diagnostic interrupt, OB86 rack failure, OB80 time error), they are read and parsed instantly.

Engineering Detail: Transforms hexadecimal system events into categorized severity logs: Information, Warning, Severe Hardware Fault.
4

Immediate Targeted Dispatch to Automation Leads

Urgent notifications are dispatched to the lead automation engineer and electrical supervisor via mobile push, SMS, and WhatsApp with full context.

Engineering Detail: Dispatches: e.g., "[PLC WARNING] Line 3 S7-1500: Profinet station loss at ET200SP Rack 2 Slot 4 (Module Pull/Plug event)."
5

Long-Term Health Analytics & Lifecycle Planning

Scan time trends, memory consumption growth, and communication error rates are visualized on web dashboards for predictive automation maintenance.

Engineering Detail: Identifies gradual CPU load degradation caused by software additions before watchdog limits cause line stoppages.
Industry Applications

Tailored Solutions for Manufacturing Sectors

Proven operational results across discrete and continuous processing plants.

Automotive Assembly Plants

Application: Robotic welding cell PLC CPU scan time surveillance and Profinet weld controller bus stability monitoring.

Measurable Impact: Eliminated intermittent line hesitations and prevented robotic cell communication lockups.

Pharmaceutical Formulations

Application: Cleanroom AHU and sterile filling line PLC memory and battery backup health monitoring.

Measurable Impact: Prevented batch recipe corruption following power restoration after facility electrical testing.

Continuous Chemical Processing

Application: Redundant S7-400H / ControlLogix fault-tolerant PLC synchronization and fiber link monitoring.

Measurable Impact: Ensured seamless hot-standby failover by detecting fiber optic link degradation early.

High-Speed Packaging & Bottling

Application: Multi-axis packaging machine PLC cycle time jitter and distributed servo communication monitoring.

Measurable Impact: Prevented carton jam spikes caused by intermittent 50ms scan time spikes.

Steel Rolling Mills

Application: Main drive control PLC diagnostic buffer monitoring and Profibus DP slip-ring noise tracking.

Measurable Impact: Pinpointed faulty cable shielding on moving cranes before complete bus communication collapse.
Performance Benchmark

Traditional Methods vs. Compiled Successfully Solution

Why manual spreadsheets, point-to-point scripts, and isolated SCADA fall short.

Evaluation Dimension Traditional / Manual Methods Compiled Successfully Platform Operational Impact
Diagnostic Visibility Engineer must plug laptop into PLC cabinet with programming software Continuous remote web and mobile visibility into CPU diagnostic buffer Troubleshoot controller health without entering control room
Scan Time Monitoring Checked only during initial plant commissioning Real-time millisecond scan cycle surveillance and spike alerts Detects logic bloat and watchdog risks before CPU trips
Fieldbus Health Red "BUS FAULT" LED on CPU when line is already stopped Early warning on packet retries and intermittent dropouts Fix damaged fieldbus cables before line breaks down
Memory & Battery Surveillance Discovered dead battery when PLC program is lost after power outage Automated alerts for low battery voltage and memory fragmentation Zero risk of unrecoverable machine program erasure
Our Engineering Edge: Direct native diagnostic protocol queries across multi-brand PLCs (Siemens, Rockwell, Mitsubishi, Schneider, Omron) delivering proactive controller health alerts directly to mobile devices.
Enterprise Grade

Industrial Compliance & OT Cyber-Security

Engineered strictly according to international standards for industrial automation: ISA-95 enterprise-control integration, ISA-18.2 alarm management lifecycle, 21 CFR Part 11 electronic batch records, and TLS 1.3 / mTLS outbound cryptographic security. Built-in Store-and-Forward guarantees zero telemetry loss during network drops.

Outbound-Only TLS 1.3 Encryption
Deterministic Store & Forward
ISA-95 Level 1 to 4 Data Model
ISA-18.2 Alarm Flood Suppression

Ready for a Factory Pilot?

Connect a single production line in under 3 weeks with zero line disruption.

Request Pilot Demo
Industrial Hubs Served

Nationwide Industrial Automation Deployment

Industrial PLC controller health monitoring, diagnostic buffer alerting, and scan time surveillance for manufacturing plants across India.

Primary Industrial Corridors

  • Maharashtra (Pune, Mumbai, Aurangabad, Kolhapur)
  • Gujarat (Ahmedabad, Vadodara, Surat, Sanand)
  • Tamil Nadu (Chennai, Coimbatore, Sriperumbudur)
  • Karnataka (Bengaluru, Peenya, Mysore)
  • NCR (Faridabad, Gurugram, Manesar)

Emerging & Extended Industrial Zones

  • Telangana (Hyderabad)
  • Rajasthan (Bhiwadi, Neemrana)
  • Madhya Pradesh (Pithampur)
  • West Bengal (Kolkata)
  • Andhra Pradesh (Visakhapatnam)

Frequently Asked Questions

Technical and operational answers for plant managers and automation engineers.

Our system utilizes native system communication services (such as S7 ISO-on-TCP system status list queries in Siemens or CIP Generic GSV services in Rockwell). These queries are handled entirely by the PLC's underlying operating system firmware and do not require adding rungs, memory blocks, or cycle-lengthening ladder logic to your production program.

Yes. The system continuously tracks communication statistics including packet retry counts, cyclic frame jitter, and diagnostic interrupts across all configured remote I/O racks and drives. It alerts engineers when packet loss begins to rise, allowing them to replace damaged patch cords or noisy slip rings before an emergency bus fault trips the machine.

The health monitoring engine detects CPU state transitions within 500 milliseconds. If a controller switches to STOP mode, a critical priority alert is instantly blasted via SMS, WhatsApp, and phone call to automation leads, specifying the exact timestamp and the last recorded diagnostic buffer error that triggered the shutdown.

Yes. We support mixed multi-vendor environments within a single unified dashboard, including Siemens (S7-1500, S7-1200, S7-300, S7-400), Rockwell Allen-Bradley (ControlLogix, CompactLogix, MicroLogix), Mitsubishi (MELSEC Q, iQ-R, FX), Schneider Electric (Modicon M580, M340), and Omron (Sysmac NJ/NX).

High-speed automated machines require predictable, deterministic response times. If scan times creep upward due to poorly optimized logic or communication interrupts, high-speed sensor inputs may be missed, causing machine hesitations, bad cuts, or tooling crashes. Alerting on scan time spikes allows engineers to optimize program routines before problems manifest physically.
Free Demo Available

Ready to Improve Your Factory Alarm & Alert Management?

Discuss your PLC, SCADA, machine monitoring, IIoT or Industry 4.0 requirement with our industrial automation team. See how PLC events, SCADA alarms, machine downtime and industrial conditions can be monitored through web dashboards and mobile alerts.

Serving manufacturing plants across Delhi NCR, Haryana, Maharashtra, Gujarat, Tamil Nadu, and PAN India
Call Now WhatsApp Request Quote