
Production dashboards only create value when they make plant conditions easier to understand and act on across roles.
The best industrial dashboards are not visual clutter. They show the right machine states, KPI trends, losses, and alerts for each audience, whether that is an operator, supervisor, maintenance lead, or plant manager. Good dashboard design improves situational awareness, sharpens review meetings, and reduces the time needed to find what actually changed on the floor.
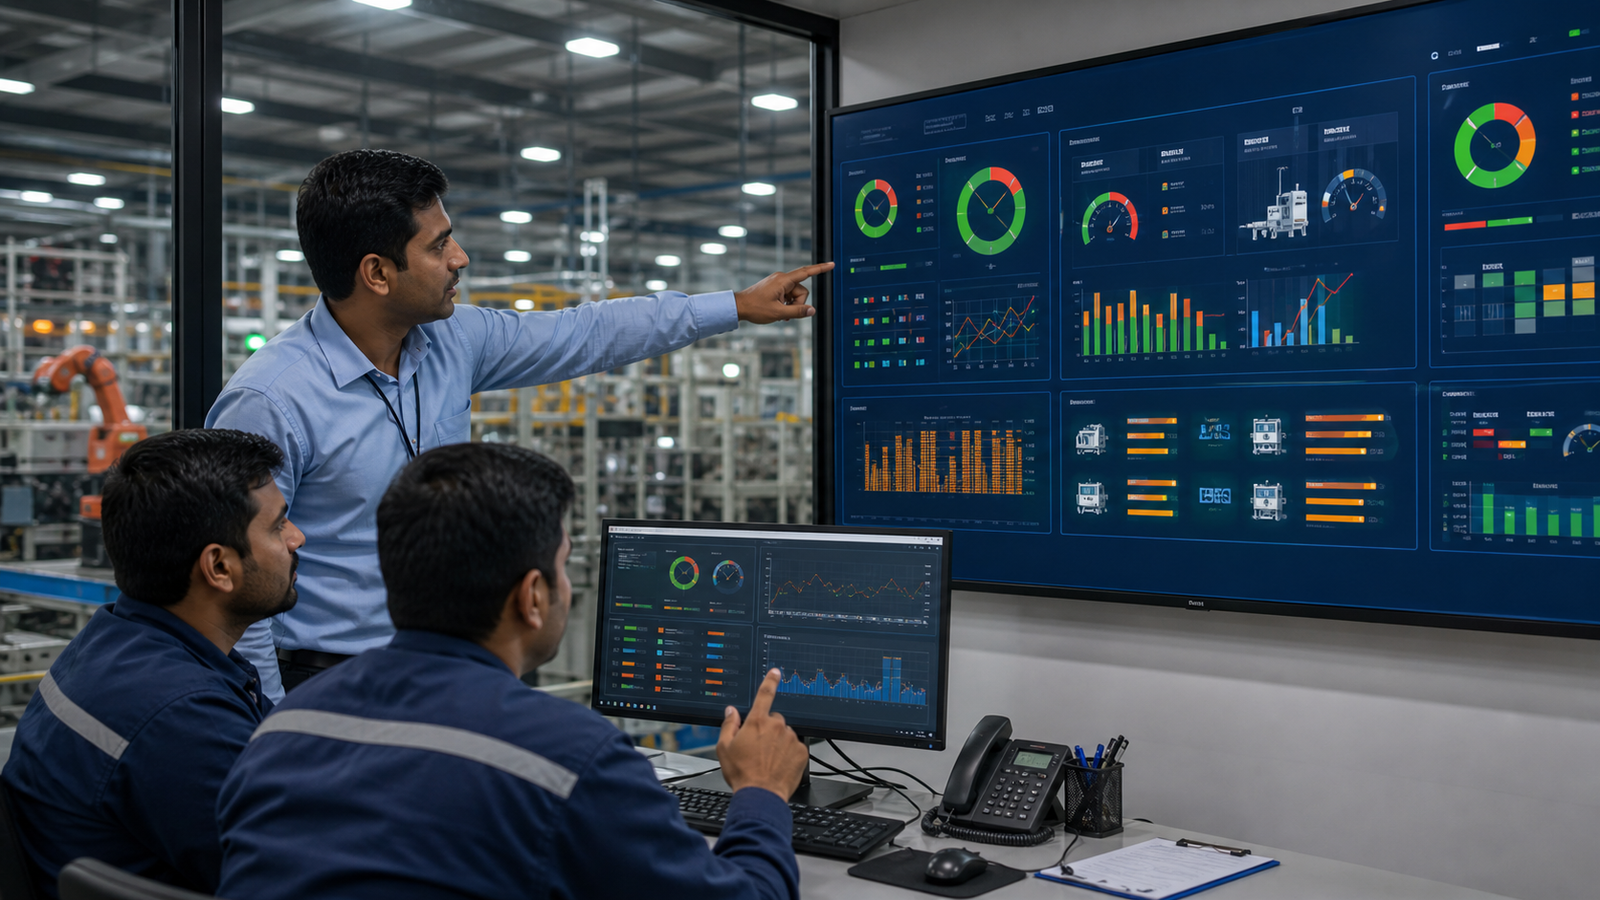
The best industrial dashboards are not visual clutter. They show the right machine states, KPI trends, losses, and alerts for each audience, whether that is an operator, supervisor, maintenance lead, or plant manager. Good dashboard design improves situational awareness, sharpens review meetings, and reduces the time needed to find what actually changed on the floor.
The highest-performing projects align automation decisions with uptime, quality, safety, reporting, and maintenance outcomes instead of treating technology as an isolated purchase.
We focus on practical execution steps that can be implemented around existing machines, controls, and plant teams.
A short discovery review usually saves time, avoids scope gaps, and improves the odds of a clean implementation.
The plant had data but lacked role-specific dashboards that could help teams identify losses and act on them quickly.
Solution: We mapped the dashboard audiences and designed KPI views that matched operational and managerial decisions more closely.
Discuss production dashboard design and rollout with our team to map requirements, identify quick wins, and plan a practical rollout for your plant.